The validity urine color scoring at different light conditions to assess low versus high urine concentration.
Wardenaar F, Armistead S, Boeckman K, Butterick B, Youssefi D, Thompsett D, Vento K. J Athl Train. 2021 Jul 30. doi: 10.4085/1062-6050-0389.21. Epub ahead of print. PMID: 34329430.
Full Text Freely Available
Take-Home Message
Lighting conditions influence urine color scoring.
Background
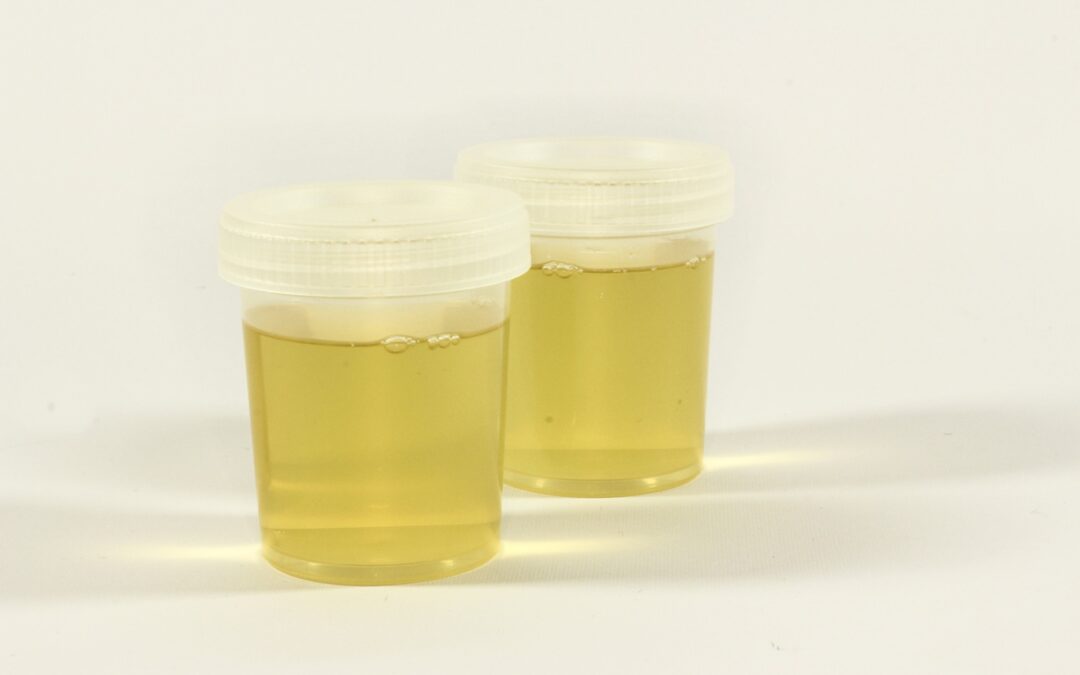
Clinicians assess urine color as a quick, readily available, and cost-effective strategy to monitor hydration status. However, we know little about how light conditions may influence urine color scoring.
Study Goal
Wardenaar and colleagues completed a laboratory study to compare the impact of different light conditions on urine color scoring.
Methods
Three experienced research technicians evaluated 178 urine samples. They used a 7-color urine color chart and 2 different scoring techniques under 4 lighting conditions. The researchers then calculated the median urine color score for each sample using data from the 3 technicians. All samples came from a healthy athletic population. The 4 lighting conditions were (1) overhead halogen light (224 lux), (2) overhead fluorescent light (420 lux), (3) LED panel (1666 lux), and (4) LED flashlight (1848 lux, brightest). The researchers scored samples using 2 different techniques: 1) holding the sample over the urine color chart and 2) looking at the sample next to a urine color chart from a standardized distance and angle). They evaluated all samples under all conditions and compared them to urine specific gravity using a refractometer (cut-off for well-hydrated status = 1.02 urine specific gravity).
Results
The lighting conditions impacted the urine color evaluation. Readers tended to report darker shade scores in lower lighting conditions (overhead halogen or fluorescent lights) than the brighter LED lighting conditions. For example, the best cut-off value for urine color scores were 4 for fluorescent lighting conditions, while a cut-off of 3 was best for the other conditions. The LED light conditions offered the most accurate results (78-80% vs. 76-77% for halogen or fluorescent lights). More specifically, the false positive rate for poor hydration status was 21 to 28% for LED light conditions but up to 31 to 37% for fluorescent or halogen light conditions. Alternatively, a reader was more likely to incorrectly indicate someone had normal hydration status during the LED light conditions (9 to 19%) than the lower light conditions (6 to 11%).
Viewpoints
Ultimately, the authors demonstrated that lighting conditions impact how people score urine color. A reader is more likely to report a false positive in rooms with less brightness and less likely to report a false negative. Readers were slightly more accurate when using a LED flashlight from underneath the sample. Interestingly, the authors also noted that clinicians might need to consider light brightness and light color. Fluorescent and halogen lighting had low brightness, but the best cut-off score for determining hydration status was similar between halogen and LED lights, which avoid green to yellow color tones associated with fluorescent lights.
Clinical Implications
Clinicians who use urine color to assess urine concentration should be aware that the conditions in which they assess urine color may impact their assessments. Clinicians who rely on color analysis should standardize their evaluation process and consider using a simple LED flashlight.
Questions for Discussion
How do you use urine color analysis in your practice? Given your experiences, how might your current facilities have impacted your clinical decision making?
Written by: Kyle Harris
Reviewed by: Jeffrey Driban
Related Posts
Ditch Your Strips for Better Urine Specific Gravity Results
Altered Hydration Status Could Impact Concussion Assessment
Cheers! The More You Move, the More You Need to Drink
Need a Boost? That Energy Drink May be More Harmful Than You Realize